Spurious Accuracy in DNA Comparison
by Paddy Waldron
Last updated: 20 July 2022
URL: http://pwaldron.info/DNA/SpuriousAccuracy.html
The various DNA companies peddling estimated ethnicity percentages
continue to damage their reputations in the eyes of anyone who has a
basic understanding of mathematics or statistics by indulging in spurious
accuracy. I found the following nice definition of spurious
accuracy in an accounting textbook:
a pretence to precision that is either unattainable or
useless (or both).
As of 20 July 2022, the 5th longest half-identical region which I
share with a MyHeritage match to whom I have not established my
precise genealogical relationship is with Robert, who now has two
different kits at MyHeritage.
MyHeritage recognises that these two kits represent the same person:


However, MyHeritage makes no attempt to aggregate the information in
the two kits, instead presenting separate match information, with
differences that some might find surprising.
The first obvious difference is in the estimated amount of DNA
shared with me: 43.3 centiMorgans v. 50.3 centiMorgans. The large
half-identical region of 43.3cM is found in both kits, but a second
half-identical region of 7.0cM is found in only one of the kits.
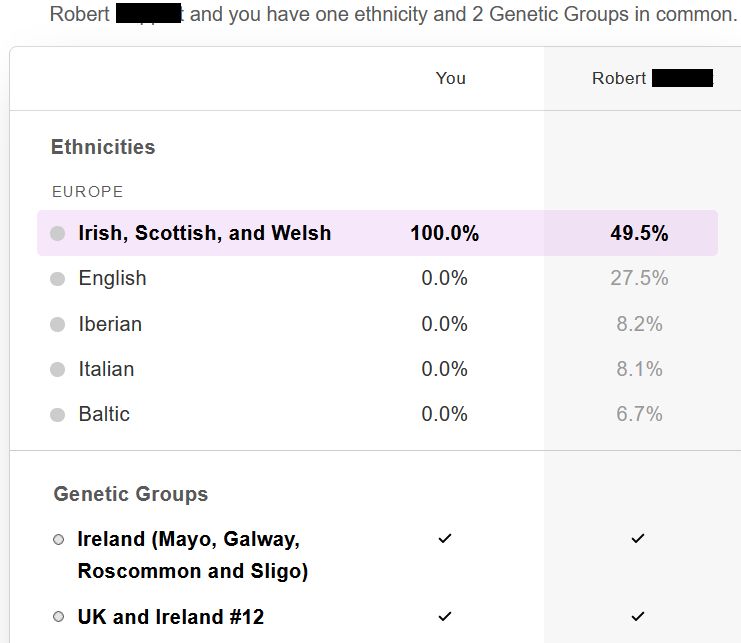
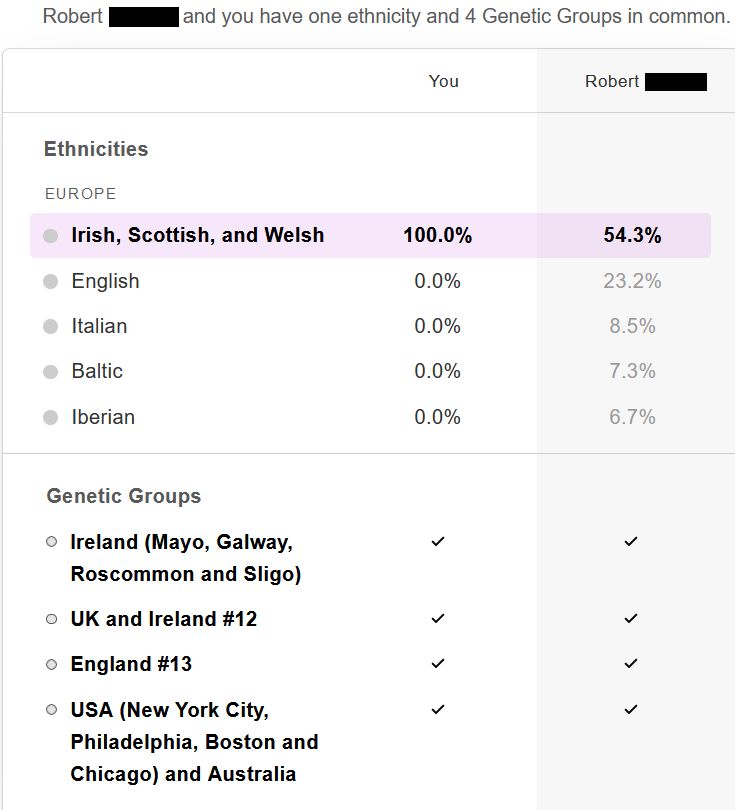
More striking are the differences in the estimated ethnicity
percentages:
- for the kit which shares two half-identical regions with mine:

- for the kit which shares one half-identical region with mine:

There are several possible explanations for the differences in
the data extracted from the same person's DNA:
- there are differences in the locations on the autosomes which
are examined both between different DNA companies and over time;
- there can be read errors by the machinery extracting the data
from the DNA sample;
- there might even be mutations in subject's DNA between the
times at which the swabs or spit were collected;
- the algorithms used for matching and for generating estimated
ethnicity percentages are changed (hopefully improved) over
time;
- estimates for older data may not be recalculated using the
newer algorithms;
- etc.
The differences between the estimated ethnicity percentages can
be as high as 22%, here in the case of Iberian, which has the third-highest estimated ethnicity percentage for one kit but only the fifth-highest percentage for the other:
| Ethnicity |
43.3cM kit |
50.3cM kit |
Ratio |
| Irish, Scottish, and
Welsh |
54.3 |
49.5 |
0.91 |
| English |
23.2 |
27.5 |
1.19 |
| Italian |
8.5 |
8.1 |
0.95 |
| Baltic |
7.3 |
6.7 |
0.92 |
| Iberian |
6.7 |
8.2 |
1.22 |
Presenting these estimated ethnicity percentages to three
significant digits (or one tenth of a percentage point), with no
reference to the associated margins of error, will undoubtedly cause
many customers to treat them as far more accurate than they actually
are. In the words of the accountant's definition, the DNA
companies are undoubtedly guilty of a pretence to precision that is
both unattainable and useless.
The DNA companies displaying smaller geographical areas under titles
such as "Genetic Groups" do appear to realise that it is impossible
to quantify precisely the proportion of a customer's ancestry
attributable to these smaller areas. It is still a surprise to
see that the presence or absence of such smaller areas is so
sensitive to what should be just measurement error. In these
case, two different Genetic Groups appear or disappear completely
for no apparent reason.


